Step 1: Make it
What is it?
Use your BBC micro:bit as a data logger to survey things you see, like different kinds of traffic or wildlife, or answers to questions.
Introduction
Coding guide
At the press of a button, the micro:bit records what you have seen and stores the data in a table so you can analyse it later.
Data stays on your micro:bit even if you disconnect the batteries or USB cable, so you can study it when you're back at your computer.
What you need
- a micro:bit V2
- a computer and micro USB cable for coding the micro:bit and viewing your data
- micro:bit battery pack (optional but recommended)
- our data logging guide may be useful
Gather data
- Transfer the program below to your micro:bit.
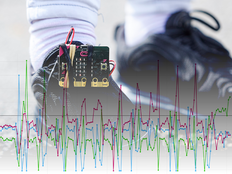
- You can record data anywhere if you unplug the micro:bit from your computer and connect a battery pack.
- A tick appears to show it's ready to start logging.
- Any previous data is erased when you transfer new code to your micro:bit, but you can also delete any old data by pressing buttons A and B together.
- Press button A to record when you see a car, button B when you see a bus and press the gold touch logo when you see a truck.
TIP: Make sure you hold your micro:bit by the edges so you don't record any data by accident.
Analyse your data
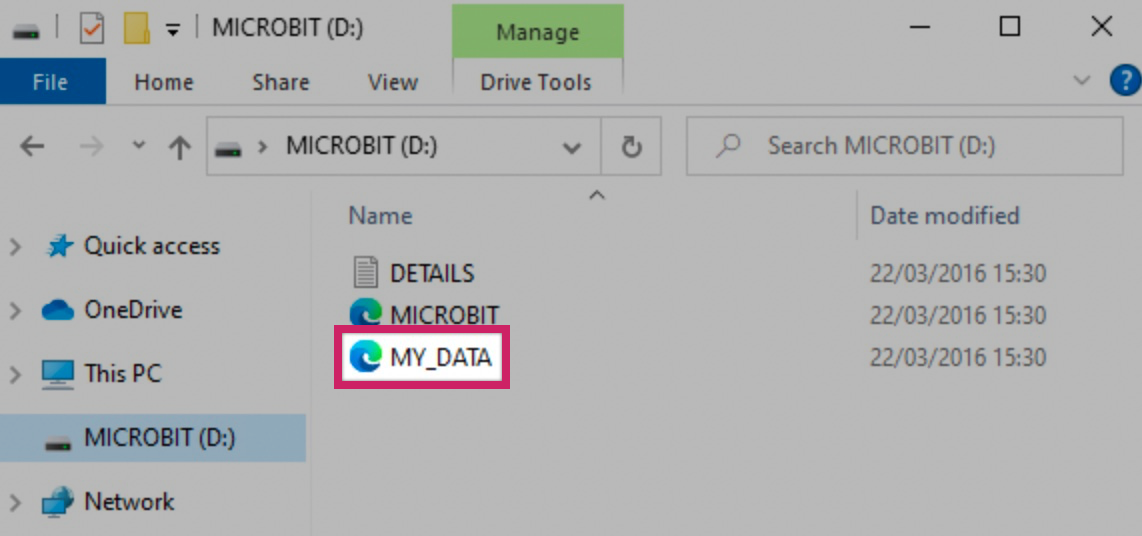
- When you've collected your data, plug the micro:bit into a computer. The micro:bit appears like a USB drive called MICROBIT.
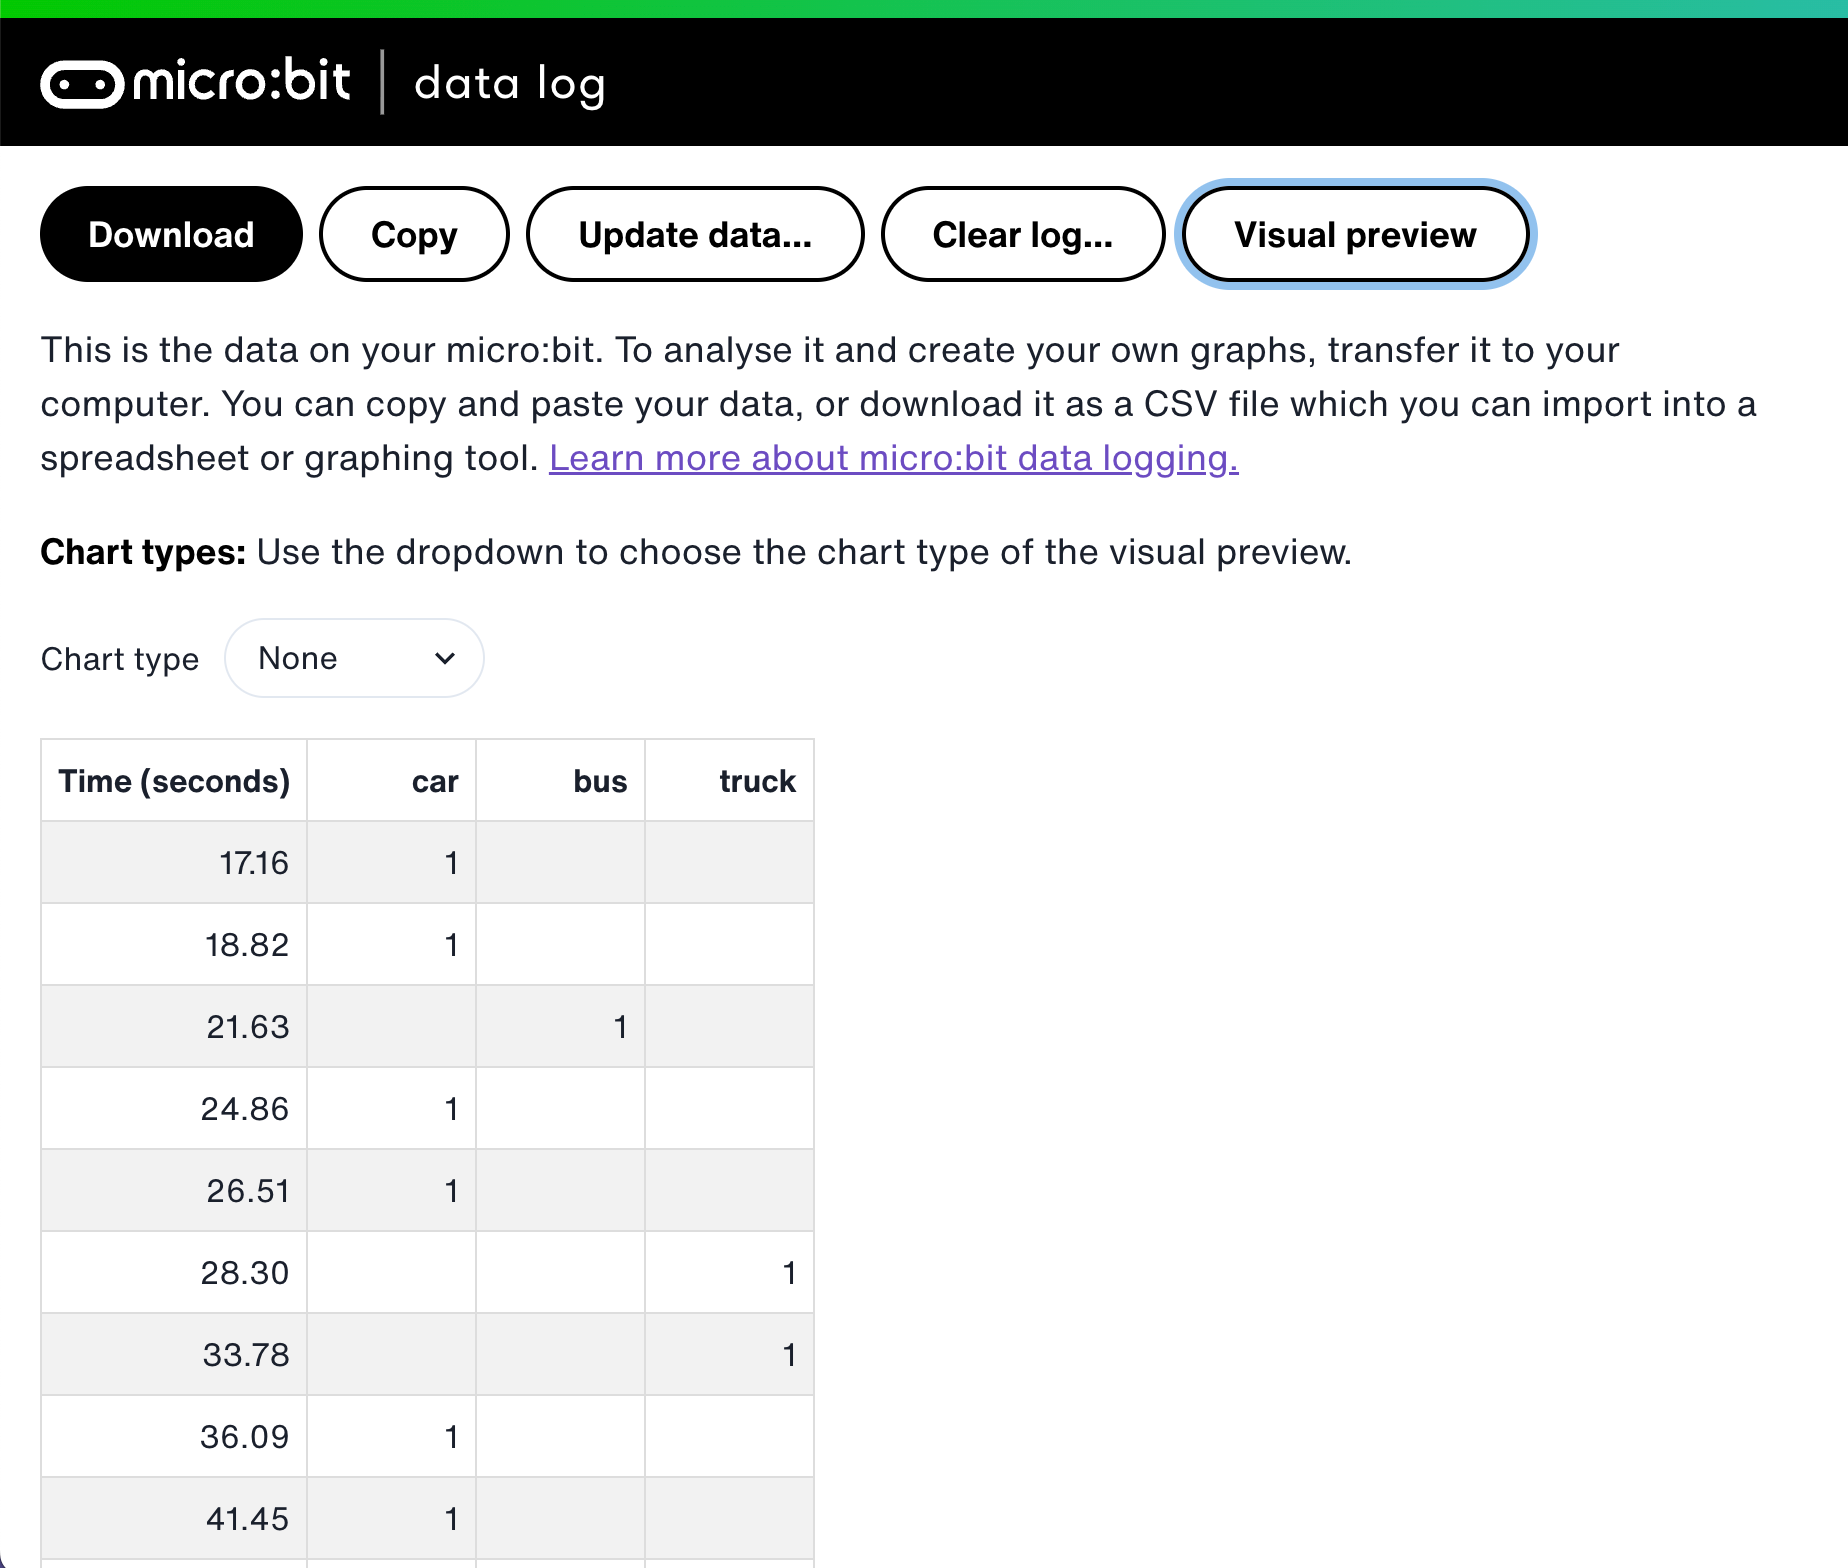
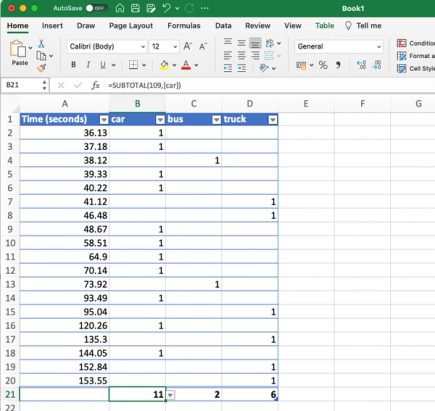
- Open the MY_DATA file to see a table of all the traffic you recorded in your web browser:
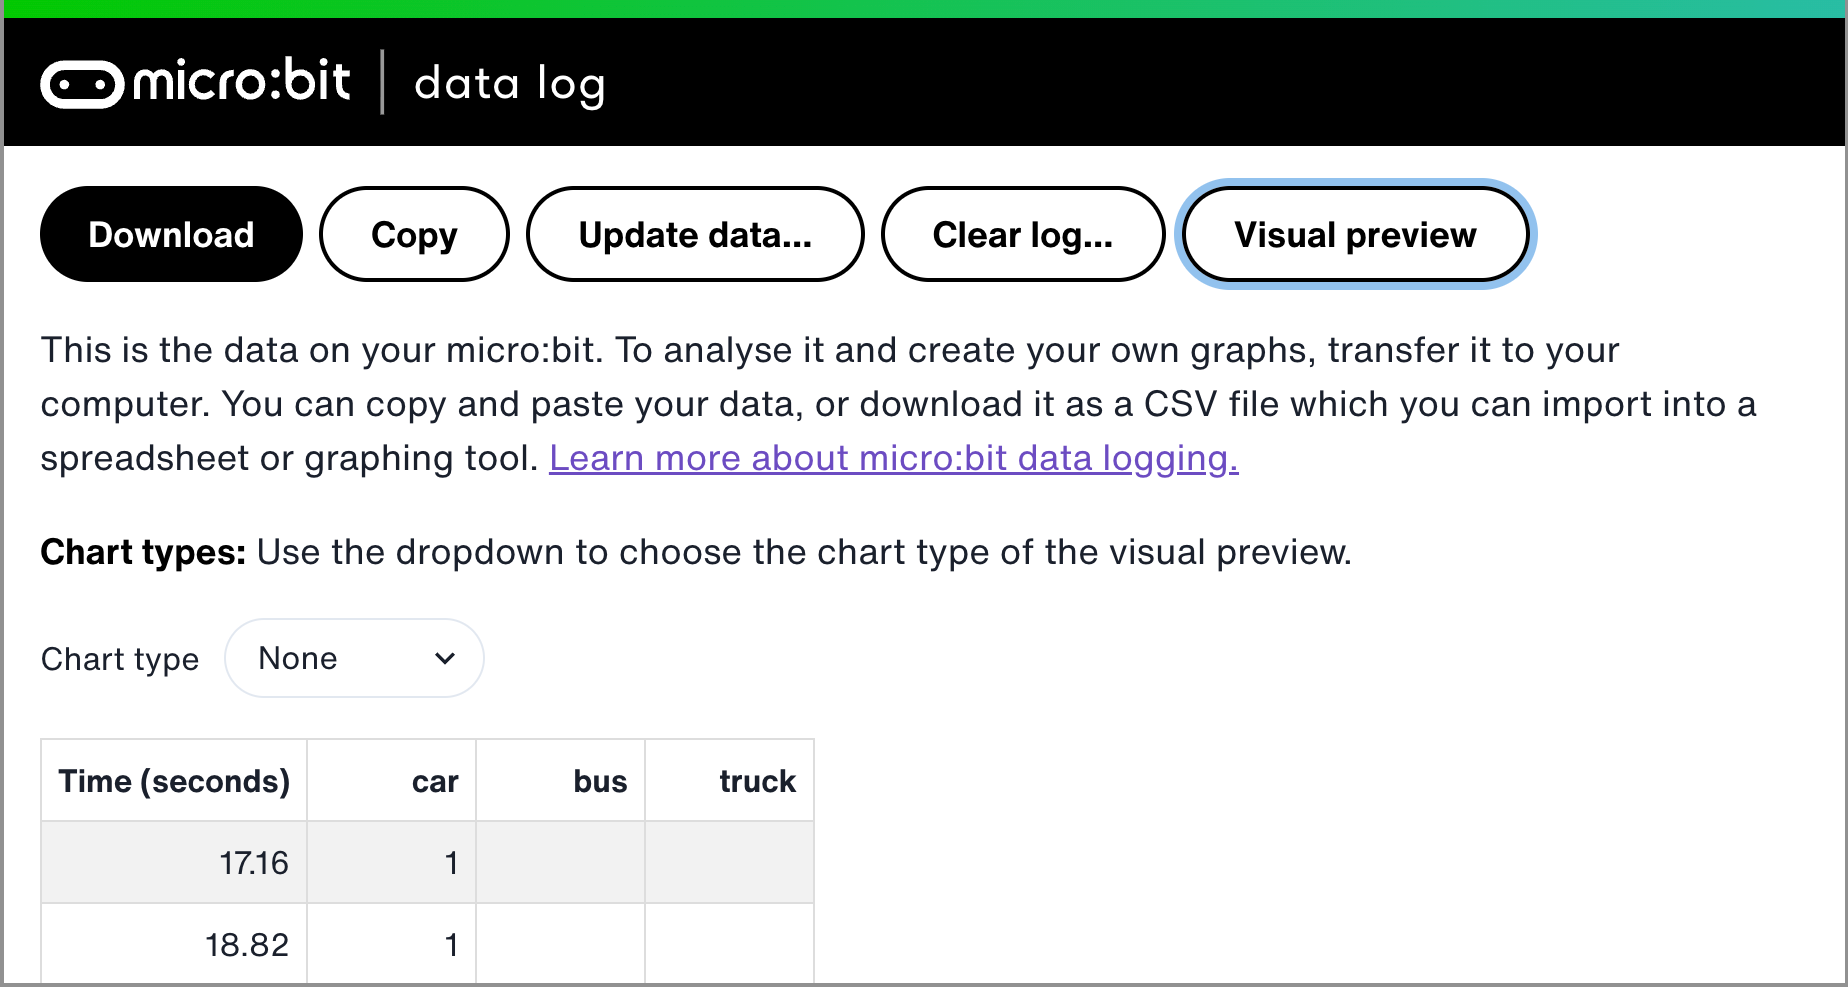
- The times recorded in the table show the amount of time that passed since your micro:bit was powered on.
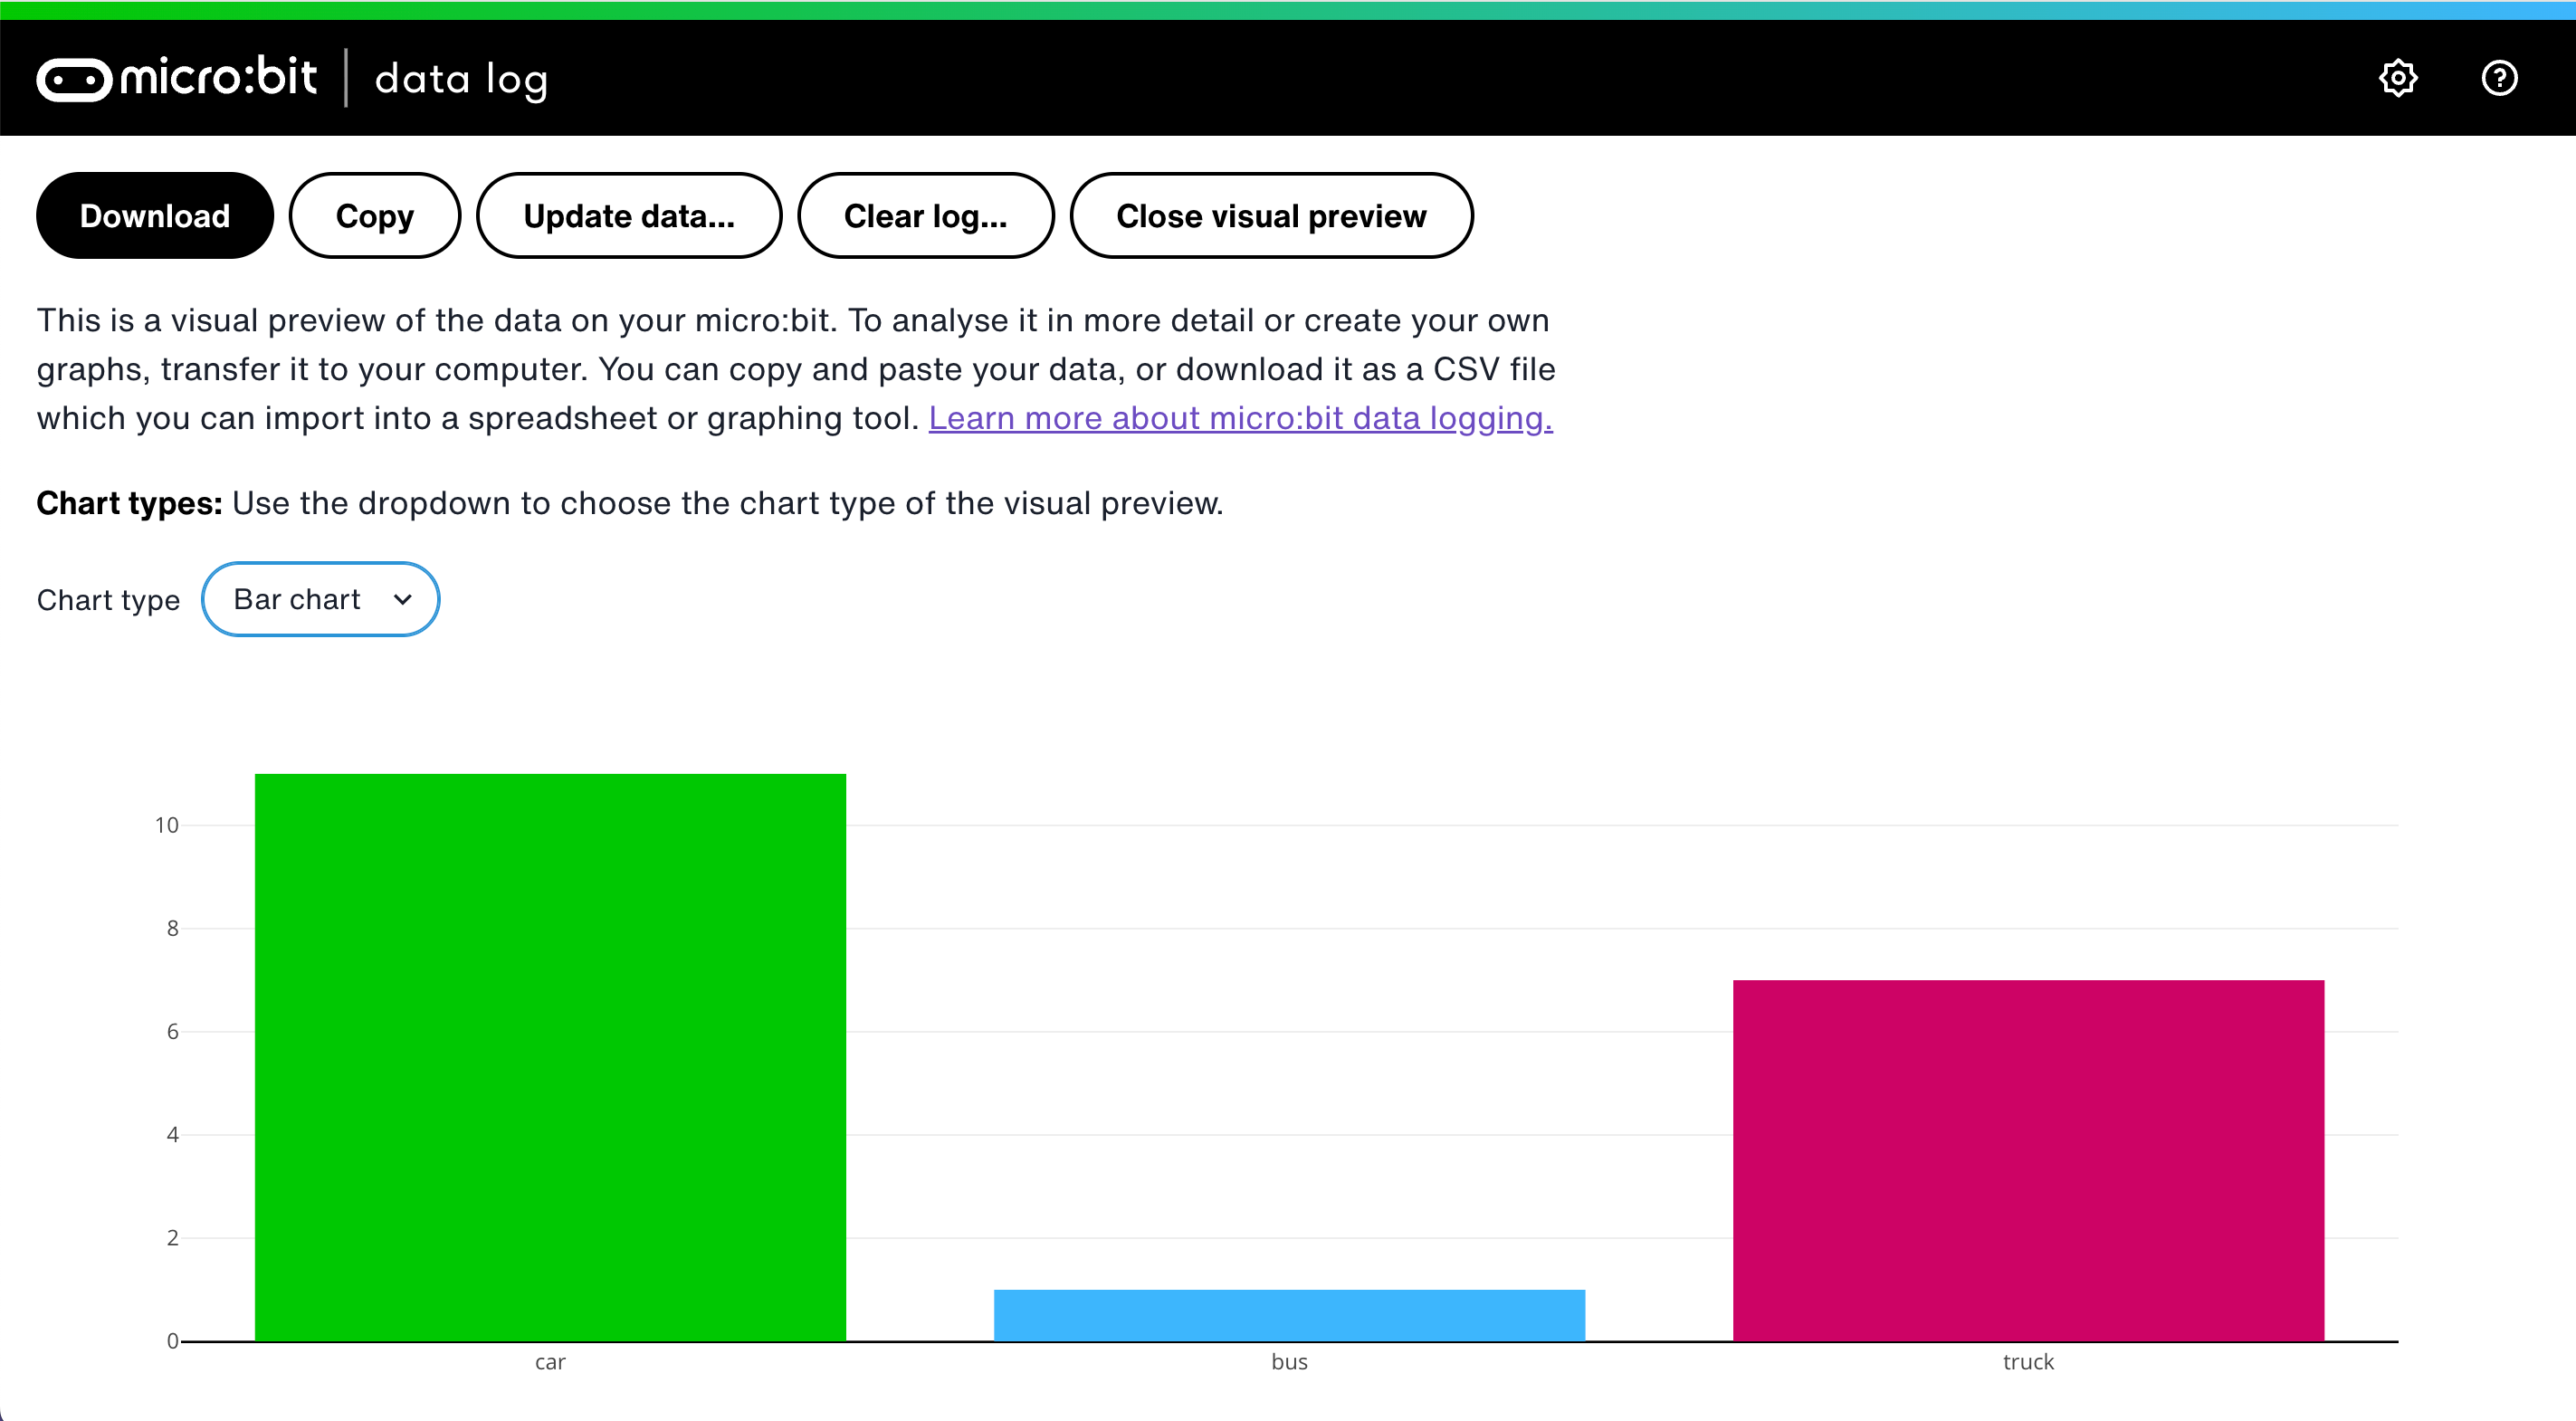
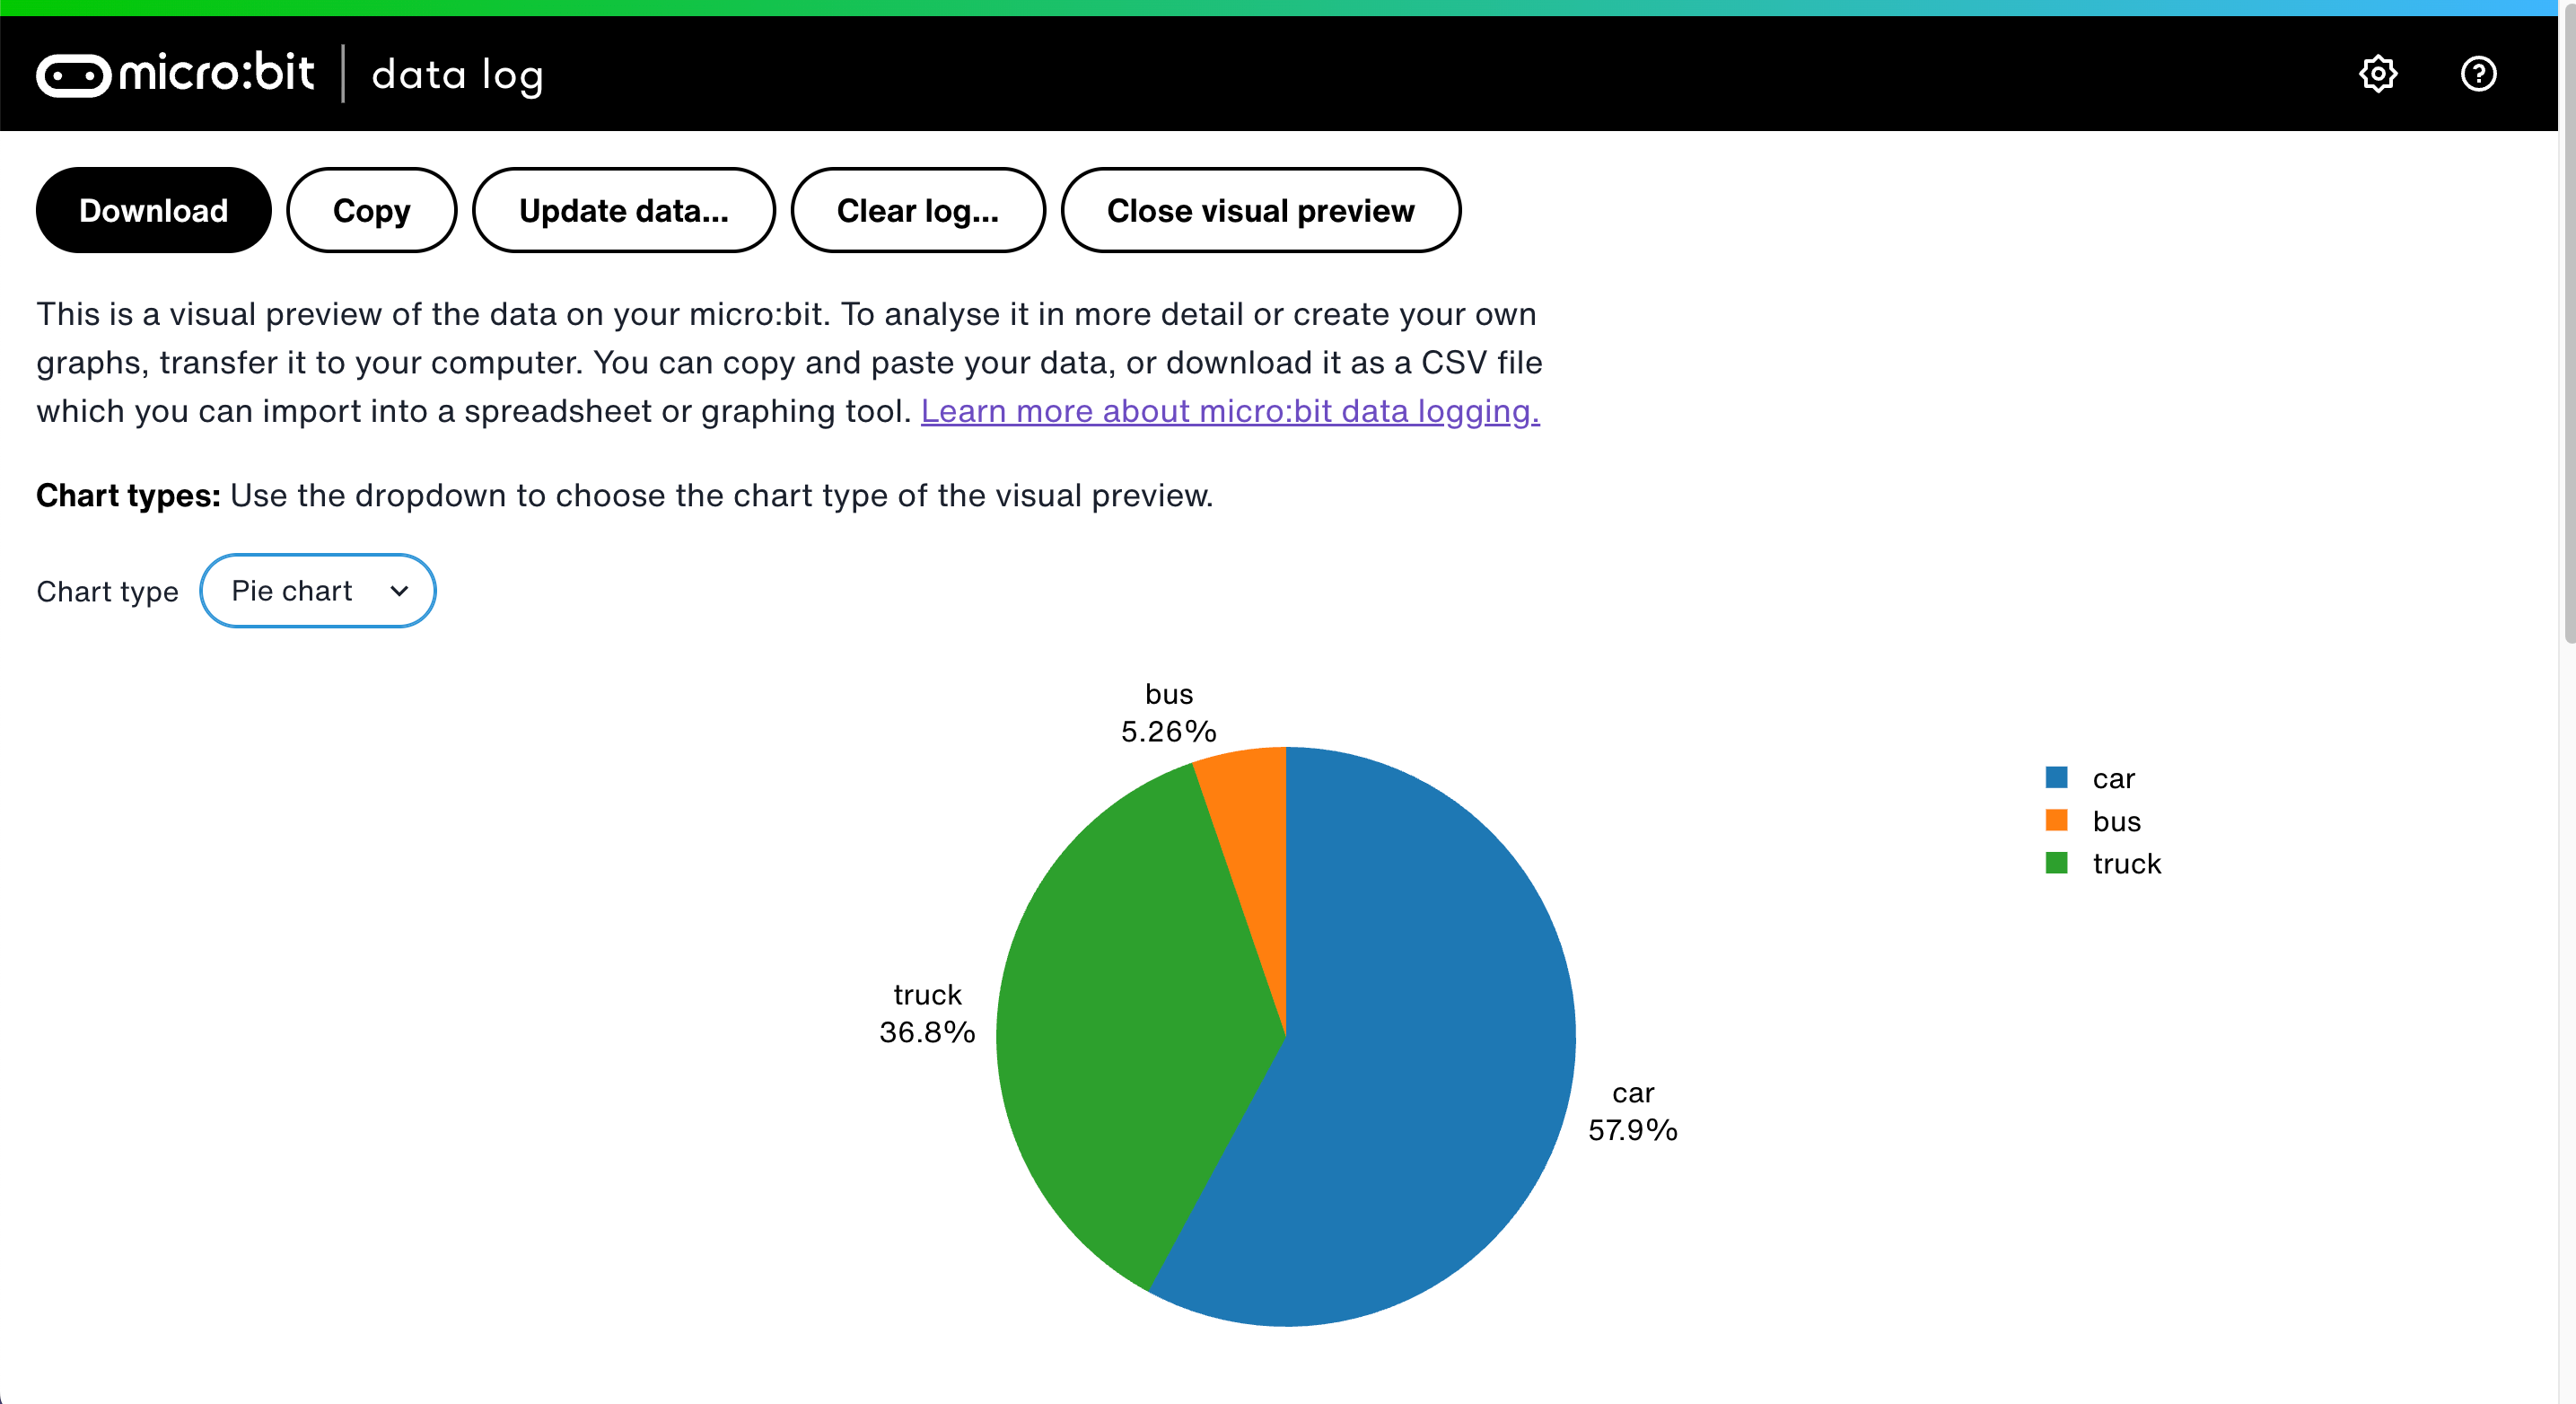
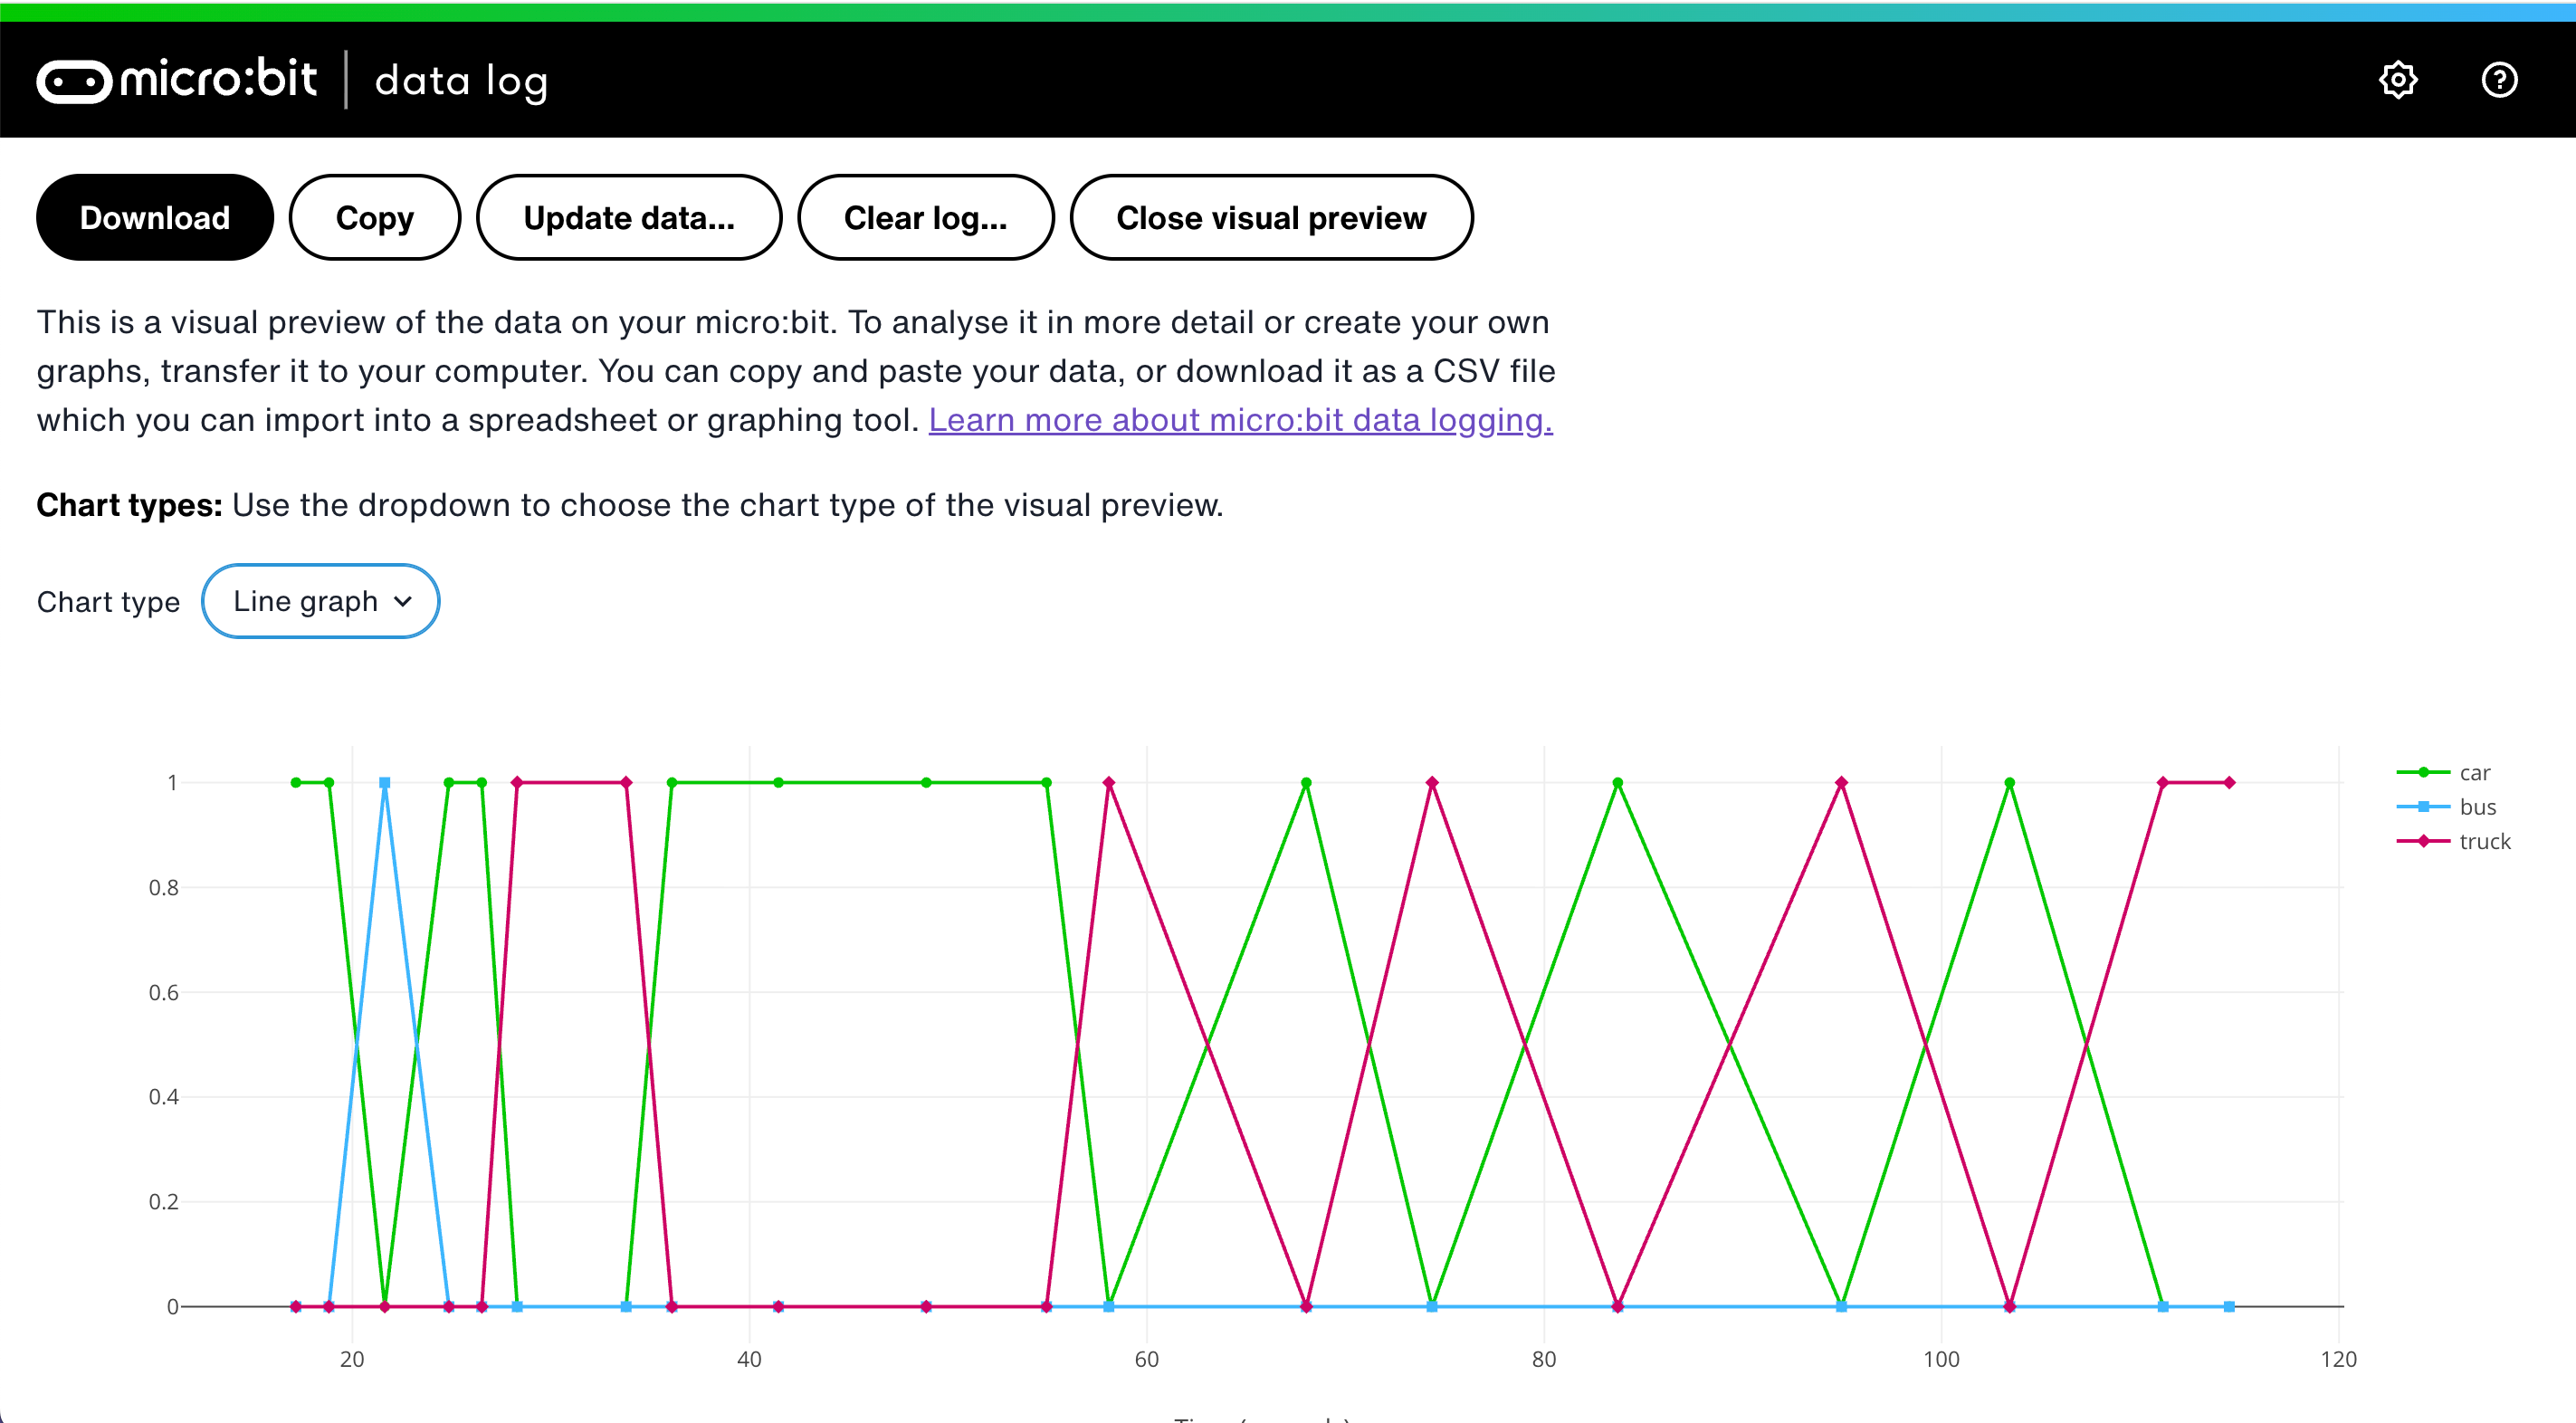
- Click on 'Visual preview.' You’ll see your data presented as a bar chart. You can also view your data as a pie chart and as a line graph showing time and sequence.
You can also:
- Add up the total of each column to make your own column or bar chart to visualise your survey data.
- Press the copy button to copy the data so you can paste it straight into a spreadsheet. Use the spreadsheet's sum function to count the total number of each kind of vehicle.
- Download the data as a CSV (comma separated values) file which you can also import into a spreadsheet.
Step 2: Code it
Step 3: Improve it
- Remix the code to count different things:
- different kinds of wildlife in your area
- do a litter patrol to count recycling, compost and normal rubbish
- carry out a survey of how people get to school, for example, walk, bus or bike
- survey people's votes for choices of activities
- Analyse your data, write up your findings and present it back to people in your area. Can you motivate them to change behaviour around modes of transport or recycling litter?