Learn about data logging
A simple way to record, store and analyse environmental data
You can use the BBC micro:bit V2 as a data logger by recording data from its built-in sensors. Data is stored on your micro:bit even when its power source is disconnected.
What is data logging?
How does it work?
What is data logging?
Data logging is the recording of data over time. It's used in school science experiments to record environmental or physical data. This might be for short bursts of time, for example measuring the acceleration of an object as it falls, or over longer periods of time, such as recording sound levels over a day or temperature or light levels over a week or more.
Why is it useful?
The micro:bit V2 is packed with environmental sensors for light, temperature, magnetism, acceleration and sound. You can record and store data from these sensors on your micro:bit, and retrieve them later for study.
Your micro:bit retains all data even when unplugged, and no special software is needed to read it. Simply connect it to any computer and use a web browser to examine your data in tables, or visualise it in a line graph, bar chart, or pie chart. You can also download the data as a spreadsheet so your students can analyse, visualise, and interpret the data further.
Plan your data logging
Before you start, it's a good idea to plan:
- what data you want to collect
- how often you want to collect it
- if you want to add a visual indication on the LED display of when data is being collected
- how to control when data logging starts and stops
You can also decide:
- what should happen if the data log is full
- when you want to erase the data from your micro:bit - you can do this in your program, or by re-flashing a program to your micro:bit
Data logging in MakeCode
Add the data logging feature by opening a new MakeCode project, look in the Extensions block category and click on 'datalogger'.
Manual logging
In any kind of data logging, it's good practice to label your columns before you start data logging, so you'll know what the numbers represent. In this example we're going to log sound and light data, so we use the 'set columns' block with appropriate names.
The 'log data' block will log data when you press button A and show a heart icon on the LED display so that you know it's working:
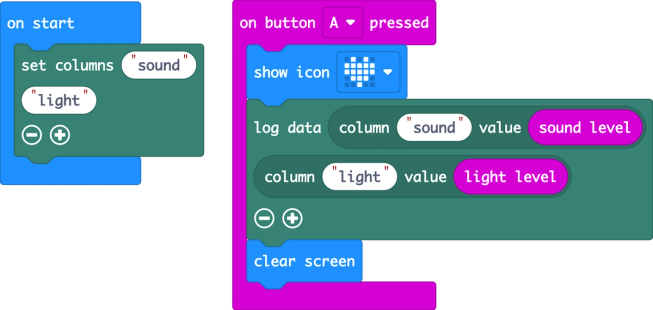
Click the image to open this project in the micro:bit MakeCode editor
Flash the program to your micro:bit, then you can disconnect it from your computer, attach a battery pack and start logging data anywhere at the push of a button. The data will stay on your micro:bit even if you disconnect the batteries.
Automatic logging
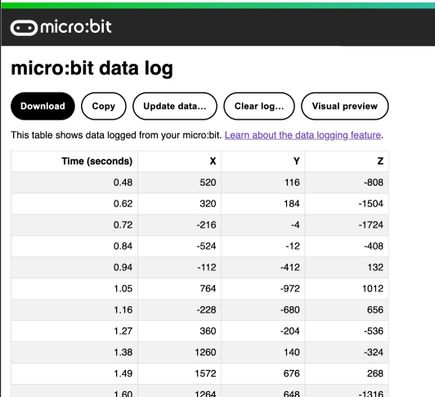
Use the 'every' block in the Loops category to capture data at regular intervals. This program will log accelerometer readings in 3 dimensions (x, y and z) ten times every second. Start and stop logging by pressing button A. The heart icon gives a visual feedback that data is being logged. You can delete the log by pressing buttons A and B together with the touch logo, and it will also warn you if the log is full.
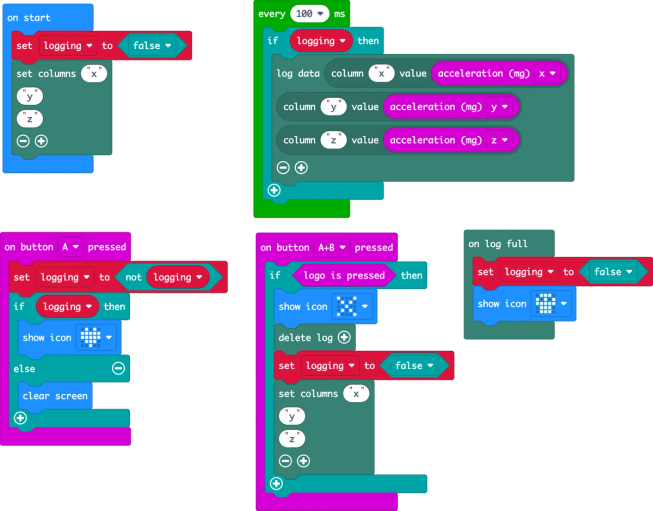
Click the image to open this project in the micro:bit MakeCode editor
Simulated logging
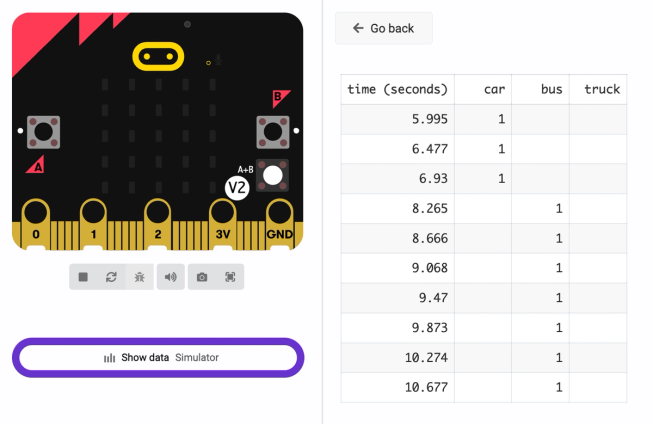
Test your data logging programs before downloading them to your micro:bit using MakeCode's simulator. Run the simulator and click 'Show data simulator' below the micro:bit display to view the simulated data.
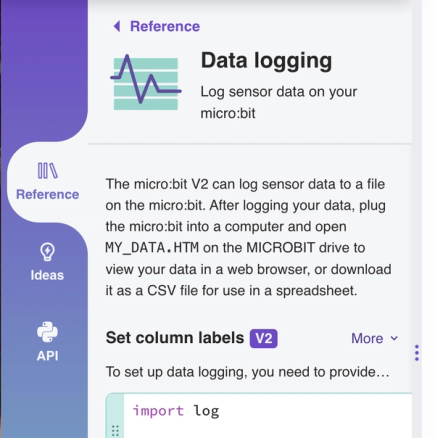
Data logging with Python
You can use data logging when coding your micro:bit V2 in Python.
First, add import log to the start of your program.
Set your data log column headings using log.set_labels()
Then add records to your data log with log.add()
You retrieve your data in the same way as described above.
Learn more about data logging in Python.
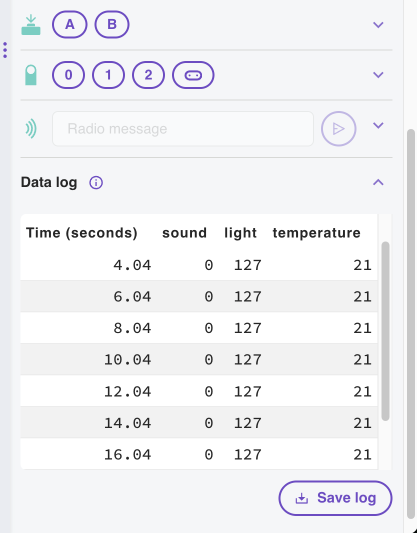
Simulated logging
Test your data logging programs in the simulator before downloading them to your micro:bit. Run the simulator and expand the data log module to view the simulated data.
Reading your data
Once the data has been logged on the micro:bit, plug the micro:bit into a laptop or desktop computer. The micro:bit will appear like a USB drive called MICROBIT. Look in there and you'll see a file called MY_DATA:
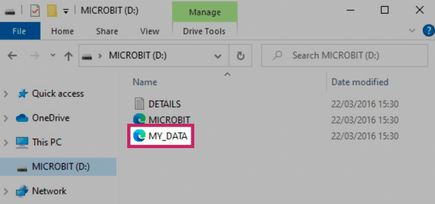
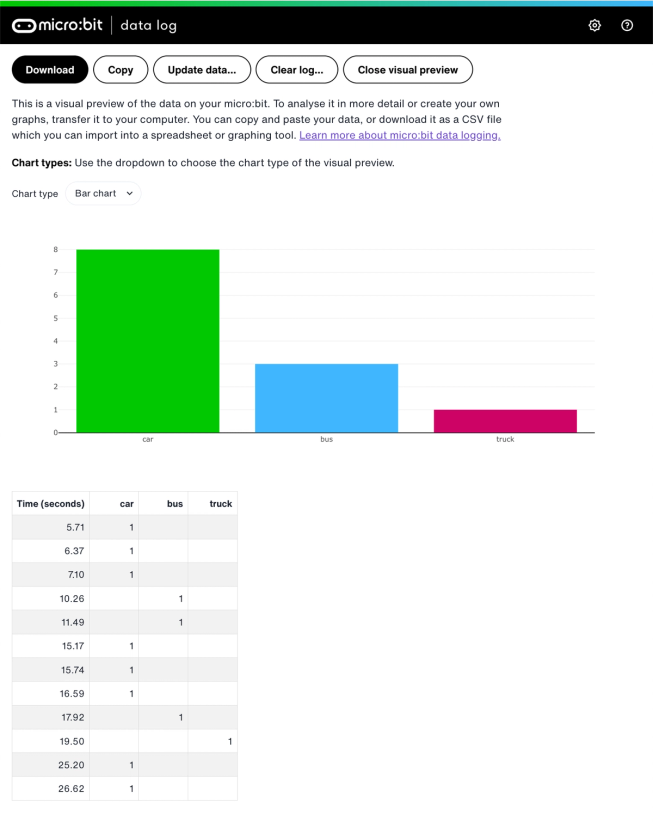
Double-click on MY_DATA to open it in a web browser and you'll see a table with your data:
You can now:
- Preview your data visually as a graph directly in the MY_DATA file on your micro:bit. You can isolate individual lines of data in the graph by clicking on the legend.
- Use the copy button to copy the data so you can paste it straight into a spreadsheet like Microsoft Excel, Google Sheets or Apple Numbers.
- Download the data as a CSV (comma separated values) file which you can also import into a spreadsheet.
When making graphs in Excel, scatter graphs are a good type to pick as they will plot your times accurately on the X-axis. In Google Sheets the default line graph is a good option.
Visualising data
You can choose how you want to visualise your data by selecting a chart type:
- Line graph is useful for seeing how things change through time, for example in a movement data logger. This visualisation option is only available if the data has a timestamp column.
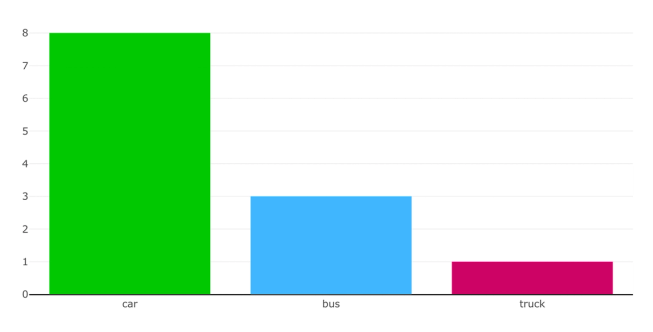
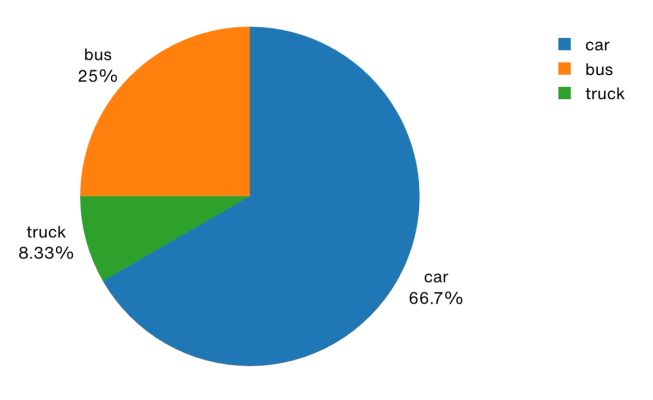
- Bar chart and pie chart is useful for visualising tally data, such as data from a traffic survey. Both options automatically chart the sum of each column. The pie chart option is available for non-negative data only.
You control your data
Your data stays on your micro:bit and on your computer, should you choose to copy or download it. It does not get uploaded to the internet or shared with anyone, unless you choose to.
Working offline
You can use your micro:bit to log data without any internet connection, though if your computer is not online, you will not be able to access a visual preview of your logged data and the MY_DATA web page will look a little different.
Time and your data
Timestamps are logged in projects by default. You can change the time units or disable timestamps entirely. The line graph visualisation option is only available if timestamps are being logged.
Time starts or restarts from zero when your micro:bit resets. This means that the times in the timestamp column represents the time since the micro:bit was last reset. A reset can be triggered in different ways, such as pressing the reset button on the micro:bit, batteries disconnecting, or using 'reset' block in your MakeCode program.
Multiple data sections in the MY_DATA page means that there has been an unexpected change in the timestamp column or a change in the column headers. Possible reasons include:
- Resetting the micro:bit whilst data logging, which resets the time to zero.
- Not setting all the column headers in the beginning of the program.
- Changing the timestamp units, or turning off the timestamp logging in the middle of your program.
Erasing data
Data is stored on the micro:bit until you take an action to erase it. You can do this by downloading a new program to the micro:bit or by programming it to delete the log. Erasing data will erase the data stored including the column headers. You will need to set the column headers after erasing the data if you would like to continue logging data.
There are two delete methods:
- Fast delete method is a quick way to no longer see your log. Whilst the MY_DATA page appears empty, the logged data is still stored in the micro:bit but is invalidated. Downloading a new program to the micro:bit uses this method.
- Full delete method takes longer and removes all the data from the micro:bit. This method can only be used by coding it into your program.
You can use either method to delete your data using log.delete in Python or the 'delete log' block in MakeCode.
Make it: code it data logging projects
Try out our data logging projects.
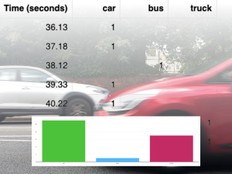
Survey traffic, wildlife or anything around you!
Record and study data about the world around you
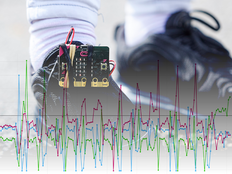
Use data logging to make a better step counter.
More about data logging
You can find more background information and FAQs about data logging on our support site.