New data logging projects
Try out data logging in your classroom with three new projects
With a few blocks of code, you can capture, store and visualise real-world data from the micro:bit's built-in sensors for temperature, light, sound, movement and magnetism.
Data logging enables your students to carry out meaningful scientific experiments, and to learn about how to collect reliable data, visualise and interpret it.
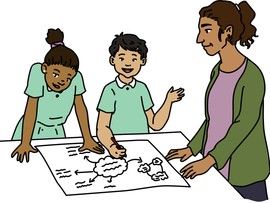
Traffic survey data logger
Use your BBC micro:bit as a data-logger to survey things you see.
In the version of the project supplied, you press button A to log every time you see a car, button B every time you see a bus, and the gold touch logo every time you see a van or truck. You can easily adapt the code supplied to log other things, such as different kinds of wildlife, or to record answers to questions.
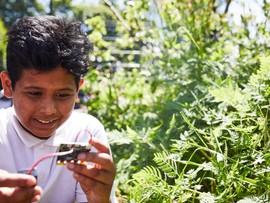
Environment data logger
This project helps you decide where plants will grow best by recording light and temperature readings at regular intervals. Press button A to start logging, button B to stop logging, and buttons A and B together to clear your data and start again.
This program can also be used to record when electric lights and heating have been left on, and can be easily modified to record sound levels to find out when and where it is noisiest in your school.
Movement data logger
Make a personalised fitness tracker with the movement data logger project. Use the micro:bit to capture accelerometer data, then use that data to make a step counter that is customised to how you walk.
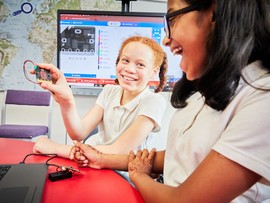
How does data logging work?
Simply open the project code your require in the MakeCode editor, flash the code to your micro:bit and attach a battery pack so that you can collect data away from your computer. Once you have collected your data, re-attach your micro:bit to your computer, open the micro:bit drive and double-click on the MY_DATA file to see the data collected in a table in a web browser.
Your data can be copied and pasted into a spreadsheet where you can make charts, or into other types of documents.