ステップ1: 作る
説明
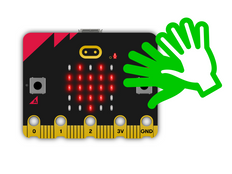
新しいmicro:bitのマイクセンサーと簡単な棒グラフ表示を使用して、周りのノイズを測定しましょう。
はじめに
プログラミングガイド
学ぶこと
- micro:bitに内蔵されたマイク入力センサーを使って、周りの音量を測定する方法
- LEDディスプレイ出力に入力センサーの数値データをグラフィカルに表示する方法
動作の仕組み
- 新micro:bitのマイクは、0から255の数字で音量を測定します。 0は最も静かで、255は最も大きな音量を測定します。
- このプログラムは、「ずっと」ループを使ってマイクセンサーで音量を測定し続けます。そして、LEDディスプレイに棒グラフを描き続けます。
- 音が大きくなるほど、棒グラフが高くなります。
必要なもの
- サウンド付きの新micro:bit(またはMakeCodeシミュレーター)
- MakeCodeまたはPythonエディター
- バッテリーパック(オプション)
ステップ2: プログラムする
1from microbit import *
2
3# function to map any range of numbers to another range
4def map(value, fromMin, fromMax, toMin, toMax):
5    fromRange = fromMax - fromMin
6    toRange = toMax - toMin
7    valueScaled = float(value - fromMin) / float(fromRange)
8    return toMin + (valueScaled * toRange)
9
10# set of images for simple bar chart
11graph5 = Image("99999:"
12               "99999:"
13               "99999:"
14               "99999:"
15               "99999")
16
17graph4 = Image("00000:"
18               "99999:"
19               "99999:"
20               "99999:"
21               "99999")
22
23graph3 = Image("00000:"
24               "00000:"
25               "99999:"
26               "99999:"
27               "99999")
28
29graph2 = Image("00000:"
30               "00000:"
31               "00000:"
32               "99999:"
33               "99999")
34
35graph1 = Image("00000:"
36               "00000:"
37               "00000:"
38               "00000:"
39               "99999")
40
41graph0 = Image("00000:"
42               "00000:"
43               "00000:"
44               "00000:"
45               "00000")
46
47allGraphs = [graph0, graph1, graph2, graph3, graph4, graph5]
48
49# ignore first sound level reading
50soundLevel = microphone.sound_level()
51sleep(200)
52
53while True:
54    # map sound levels from range 0-255 to range 0-5 for choosing graph image
55    soundLevel = int(map(microphone.sound_level(), 0, 255, 0, 5))
56    display.show(allGraphs[soundLevel])
57 ステップ3: 改善する
- 音の大きさを表示する独自の方法を作成します。例えば、絵文字の大きさに応じて絵文字を表示します
- 音が一定のレベルを超えたときにのみ点滅する視覚的なノイズアラームを作成します - 教室を静かに保つため使用できます